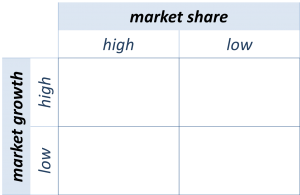
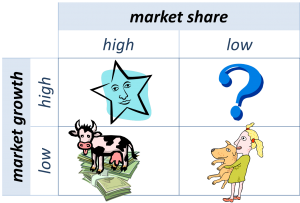
The BCG Matrix (also commonly called the Growth/Share Matrix) is yet another two-by-two matrix, this one combining market share with market growth:
Designed to aid planning in for-profit companies with multiple products, product lines, or business units, this strategic planning tool was developed by Bruce Henderson for the Boston Consulting Group in the late 1960’s.
Market Share
What portion of the total market for a product does our firm’s product occupy? If our product has a large share of the market, it’ll be in the “high market share” column. If our product has a small share of the market, it’ll be in the “low market share” column.
Market Growth
Is the overall market for a product we sell growing quickly? If so, our product will be in the “high market growth” row. If the overall market is growing slowly (or not growing at all), our product will be in the “low market growth” row.
Any of our products that are in the bottom left quadrant are dominant products in stagnant markets—”cash cows”.
Any of our products in the top left quadrant are dominant products in growing markets—”stars”.
Any of our products in the top right quadrant are in growing markets, but have only a small share of that market—”question marks”.
Any of our products in the bottom right quadrant have only a small share of a stagnant market—”dogs”.
So What?
Once all of our products are classified as either cash cows, stars, question marks, or dogs, the recommendation for action is straightforward:
- Milk your cows
- Feed your stars
- Interrogate your question marks
- Shoot your dogs
In other words:
- Cash cows (dominant products in established markets) should be generating profits. Those profits should be “milked” and invested in growing our stars (dominant products in growing markets), so that they can solidify their market dominance. Once the market for one of our stars stops growing, if we’ve done our job right, they should be a dominant product in a stable market, and can join our stable of cash cows.
- Question marks are the wild cards of our product mix. They have a foothold in a growing market. Our job as strategic planners is to figure out which of them, with the proper support, could grow to dominate their market—could become stars. Those are the ones we should invest with special care and attention. And, if we have question marks that, after review, don’t seem to have the potential to become stars, the best thing to do is drop them.
- The products that occupy a small portion of a stagnant market are almost certainly not profitable. The smart thing to do is to get rid of them. If they can be sold, they should be. If they can’t be sold, they should be dropped.
Questions
The advantage—and disadvantage—of the BCG Matrix is its memorability.
The simplicity of the measures (market share and market growth; high and low) and the catchy names of each of the quadrants makes the approach easy for planners to commit to memory.
The easy recall, however, can easily blind planners to important questions. A few of them include:
- How do we decide if a market share is “high” or “low”? If one of our products occupies 30% of a market, is that high? Certainly not if we only have one competitor. But what if we have 20 competitors, and they all have a market share smaller than ours?
- How do we decide if market growth is “high” or “low”? The extreme cases are easy—some product markets are clearly in decline, while others are clearly growing. But what are the criteria for all the cases in between? Are we supposed to look at the change in market size over the past few years, or project the likely market size over the foreseeable future?
- Why are low-growth markets lumped together with stagnant and declining markets? Wouldn’t it make more sense to have four market growth rows rather than two?
- This strategy tool tells us to take money from our cash cows and invest them elsewhere. But these are the main reason our company is profitable! Shouldn’t we do everything possible to protect that market dominance, including plowing money back into the product and its marketing?
Some of these questions can be resolved through a rigorous application of the original Boston Consulting Group method, which included quantification of the axes.
Core Problem
The core problem with the BCG Matrix is the assumption built into the model about profitability.
The intention of the BCG Matrix was always to help companies sift through their various product lines and focus their attention and resources on those products that have the potential to make the most profits.
However, neither axis measures profitability. Granted, a dominant product in a mature market is likely to be a profitable cash cow. But not all are.
Why not simply measure profitability directly?
Value
Despite the weaknesses of the BCG Matrix, it probably does have one value—pushing companies to look at legacy products rationally. Many companies started out making a single, distinctive product. The company may have grown on the strength of that product
But, for better or for worse, times change.
The market for the company’s founding product may be in decline. The company’s share of that market may be in decline. The company’s legacy product is now, in all likelihood, a dog. The is a hard reality for many companies—and many owners—to face. But if it is the reality, clinging to that legacy product can kill a company. In this situation, a BCG Matrix exercise might be the best way to bring make that reality clear.


